Understanding The Milky Way

Only in the Milky Way and it's satellite galaxies do we have the ability to see and take detailed data on individual stars: We are able to take spectra of the these stars to measure the abundances of the chemicals that make them up, and measure their motions to understand their orbits.
The chemicals that make up stars reflect the composition of the gas cloud from which they formed, and each element is produced by different proccesses over the lifetime of our Galaxy. The stars that make up the Milky Way are therefore the key fossil relics for understanding how our home Galaxy formed and evolved, a process called Galactic Archeology. As our home Galaxy, the Milky Way holds a special interest. But by building a narrative for how it formed and evolved, we can also use it as a template to understand how other similar Galaxies grew.
The Nature of Dark Matter

We have multiple lines of evidence that around 85% of the matter in the universe is dark matter: Without dark matter galaxies and galaxy clusters would fly apart, and it is needed to understand our measurements of the cosmic microwave background. However dark matter remains mysterious and all evidence for its existance are inferences from its gravitational pull.
Because of this there are many theories about the make up of dark matter. I am interested in using data from the Milky Way, where we have the unique ability to measure the motions of individual stars, to confront these theories.
I have written papers on the amount and shape in the Milky Way. Together with collaborators we have shown that the central Milky Way is a promising place to catch decaying dark matter and that there are indications that dark matter may not be producing the expected cusp at the Galactic center.
Image adapted from my work here.
Data Driven Astronomy
I think that Astronomy and Astrophyics is fundamentally driven by data, and that advances in almost always come from pioneering data.
The Gaia satellite was launched in 2013 and has just released equisite data on more than a billion stars. Complementing Gaia are several groundbased surveys that will take data, particularly spectra, on an unprecedented scale over the coming decade. I am particularly involved in the WEAVE survey which will take spectra of more than a million stars over 2020-2025+. It is this influx of Galactic data has driven my switch to working on the Milky Way after a PhD which focused mostly on the dynamics of stars near supermassive black holes.
Movie made by applying Gaia DR2 errors to the models from Portail et al. 2017.
Research Interests
Research Interests
Understanding The Milky Way
The Nature of Dark Matter
Data Driven Astronomy
Resume
Resume
I'm currently a Marie Curie Fellow at the Observatoire de la Côte d’Azur in Nice, France. Before that, I was a postdoc at MPE in Munich, and I did my PhD at Caltech in the US. However, I'm British and did my undergraduate degree at UCL in London.
The Milky Way's Force Field

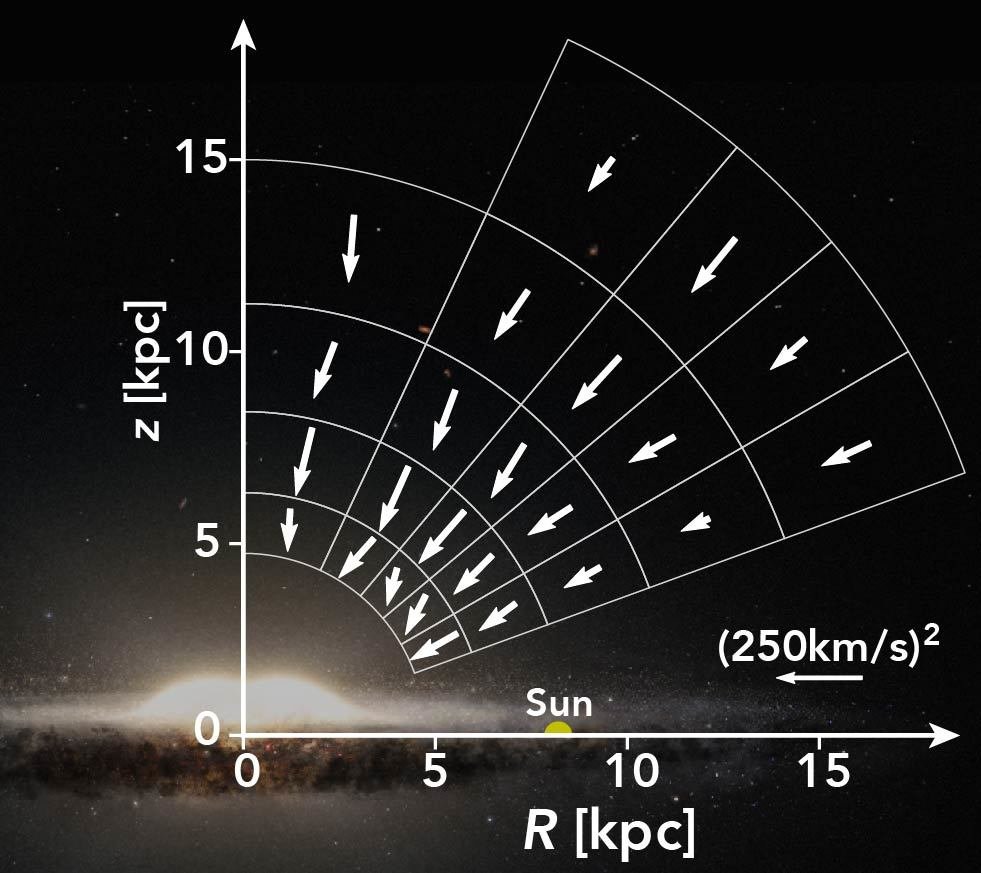
This plot shows the strength and direction of the gravitational forces in the Milky Way's halo. The forces are too strong to be produced by the matter that we see, with the remainder being the gravitational force from unseen dark matter. Because the forces in this plot point towards the center of the Galaxy, the dark matter which surrounds our Galaxy must be almost spherical in shape.
I made this plot by using motion measurements made by the Gaia satellite of a special type of pulsating star star called RR Lyrae to which we can measure accurate distances. By assuming the Milky Way is approxiately in a steady state, and not expanding or contracting, we can use this data to measure the forces: if the stars are moving quickly then the forces must be strong in order to hold our galaxy together and vice versa.
If you are interested you can read the original paper at the publisher (paid access) , or freely from the arXiv.
An Unobscured View of the Galaxy

This plot shows the Milky Way as we would see it if there were no obscuring dust. Normally when we look at the Milky Way dust lanes heavily absorbs the light from most of the stars, especially those towards the galactic center. This plot shows the number of stars we would see if we could see through this absorbing dust.
Because of the obscuring dust its not even clear where the center of the Galaxy is. In this plot, with the dust veil lifted the center is clear, but we can also see some other interesting things: (i) the central degree 20x20 degrees of the Galaxy is called the bulge. The strange shape we see here is because our bulge is a so-called Box/Peanut bulge. (ii) The red region on the left is an asymmetry caused by the Milky Way's bar. (iii) In the outermost parts the disk of stars appears tilted slightly. This is due to the warp or ripples in the outer disk of the Milky Way.
This plot was made by combining near infrared measurements on ~700 million stars from the VVV, UKIDSS and 2MASS surveys. Each star was then individually corrected for dust absobtion from its observed colour.
The plot appeared in a work studying the chemistry of stars in the bar of the Milky Way. If you are interested you can read the original paper at the publisher , or from the arXiv.
The 3D Shape of the Milky Way's Bulge
This movie shows my 3D measurement of the shape of the cental bulge of the Milky Way. It is a map of the central regions using red clump stars. Red clump stars are useful because they are 'standard candles', all have almost the same intrinsic brightness. This means that we can estimate the distance to each red clump star accurate to ~10%.
We divided the VVV survey of the inner Milky Way into ~200 lines-of-sight towards the bulge. We measured the density of red clump stars along each line-of-sight and then assembled these measurements into the 3D map which is visualised above.
If you'd like to use the movie then you can download it here. The movie was made using the VisIt tool.
The measurement is summarised in an ESO messenger article. The work is fully described in the original paper at the publisher , or from the arXiv.An Unobscured View of the Galaxy

This plot shows the Milky Way as we would see it if there were no obscuring dust. Normally when we look at the Milky Way dust lanes heavily absorbs the light from most of the stars, especially those towards the galactic center. This plot shows the number of stars we would see if we could see through this absorbing dust.
Because of the obscuring dust its not even clear where the center of the Galaxy is. In this plot, with the dust veil lifted the center is clear, but we can also see some other interesting things: (i) the central degree 20x20 degrees of the Galaxy is called the bulge. The strange shape we see here is because our bulge is a so-called Box/Peanut bulge. (ii) The red region on the left is an asymmetry caused by the Milky Way's bar. (iii) In the outermost parts the disk of stars appears tilted slightly. This is due to the warp or ripples in the outer disk of the Milky Way.
This plot was made by combining near infrared measurements on ~700 million stars from the VVV, UKIDSS and 2MASS surveys. Each star was then individually corrected for dust absobtion from its observed colour.
The plot appeared in a work studying the chemistry of stars in the bar of the Milky Way. If you are interested you can read the original paper at the publisher , or from the arXiv.
The Bar of the Milky Way

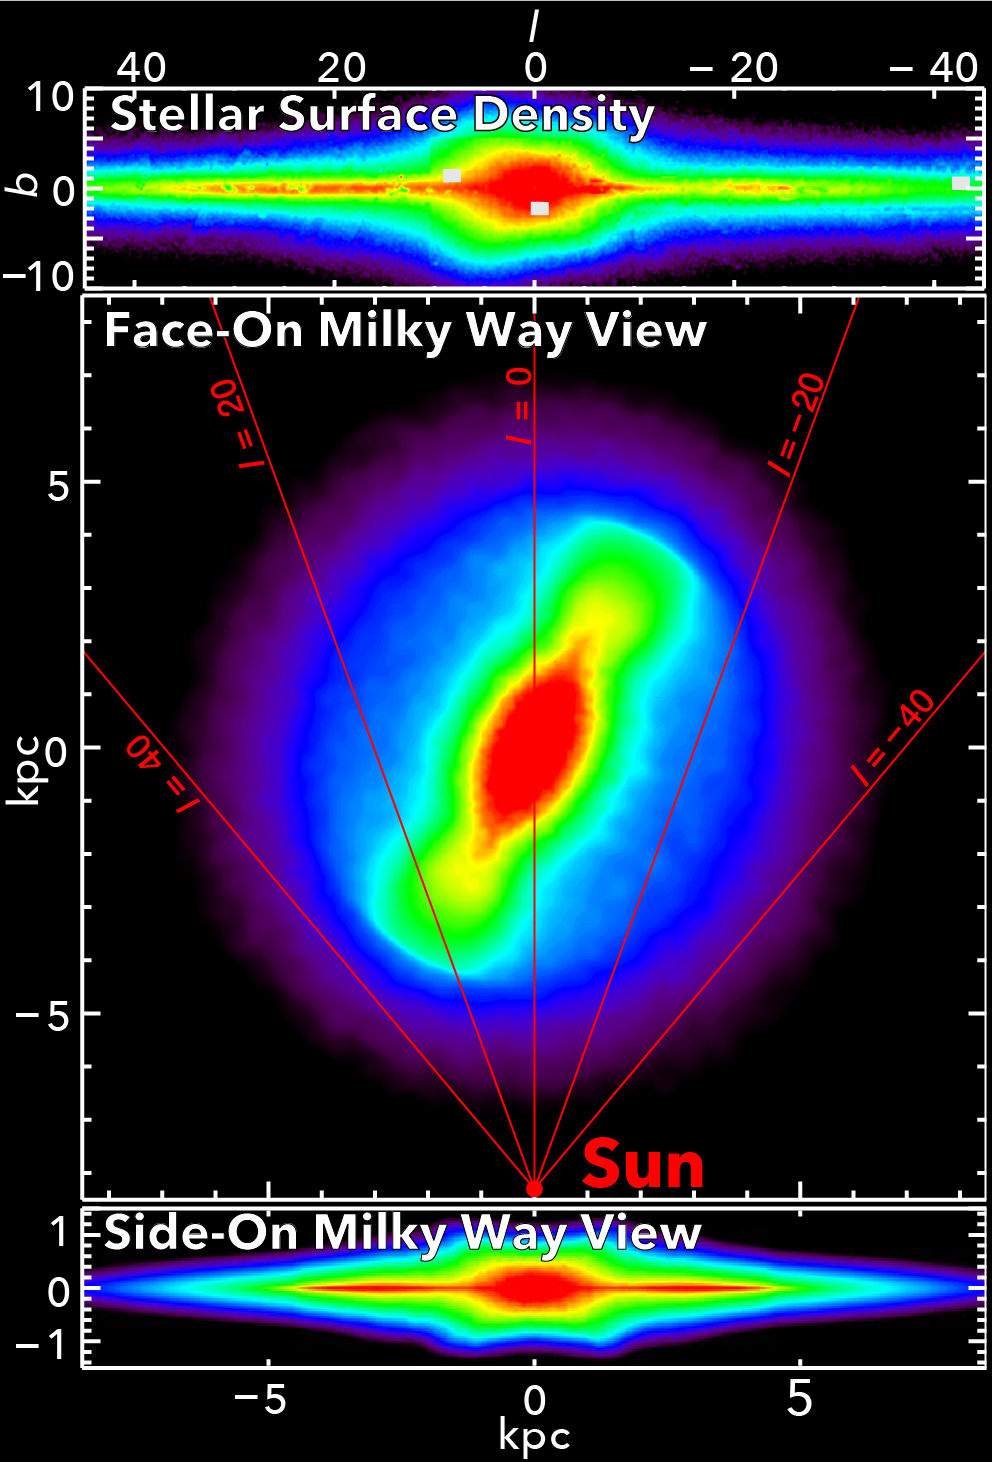
This plot shows the density of stars in the central barred region of the Milky Way from above and viewed side on to the Galactic bar.
It was made my combining measurements of red clump stars from the VVV, UKIDSS and 2MASS surveys. This data was modelled non-parametrically in the central bbulge region and parametrically for the bar outside the bulge. The combined map shows that the Milky Way has a Box/Peanut bulge, transitioning to a longer thinner bar outside. This is a 3D shape that we think is common in other barred disk galaxies. It also arises natually in simulations of bar unstable disks where the central part of the bar buckles into this type of 3D shape.
If you are interested you can read the original paper at the publisher , or from the arXiv.
Plot Gallery
Plot Gallery
Most of my work is turning raw data into plots that tell us something interesting. Below are some of my favourite figures from my recent work.